


There are many places you can learn about Microsoft Excel online. However, one of the best and highly reputable online learning platforms is Udemy.com.
The site has a number of affordable, comprehensive courses covering every aspect of Excel. Whether you are a complete beginner, a seasoned pro looking to further your skills, or need some extra tuition in areas such as graphs and data or financial modeling, Udemy will have a course for you.
In this top 5 review round up we have selected 5 courses that cover all the different needs of today’s Excel users. For our findings at a glance, just head to the table below.
For full reviews of each of our selected picks, plus a dedicated buyer’s guide, keep on reading.
Table of Contents
Best Excel Course on Udemy
BEST COURSE FOR BEGINNERS |  | Microsoft Excel: From Beginner to Advanced | ||
BEST COURSE FOR EXPERIENCED USERS |  | Excel Course: | ||
BEST COURSE FOR LEARNING CHARTS & GRAPHS |  | Data Visualization, Excel Charts & Graphs | ||
BEST COURSE FOR LEARNING FORMS & FUNCTIONS |  | Advanced Excel Formulas & Functions | ||
BEST COURSE FOR FINANCIAL ANALYSIS |  | Beginner to Pro, Financial Modeling and Valuation |
Udemy Excel Course Reviews

There are many different Microsft Excel courses on Udemy, and educators market their courses according to their intended targets.
As you will find by merely browsing the site, there are courses for beginners, courses for advanced users and experienced users, courses for finance professionals, and courses for statisticians.
The scope of the course varies depending on the intended target, with the Beginner to Professional User Course providing a comprehensive overview of the entire Microsoft Excel program.
On the other hand, you will also find courses limited to financial analysis, data visualization, and forms and functions. These all provide in-depth coverage of specific functions and capabilities of Microsoft Excel.
Using this form of categorization, we have filtered the course being offered in Udemy based on the course profile, intended target/students, and level of expertise required to join the course.
Following these criteria, our selected courses are as follows:
1. Best Course for Beginners: Microsoft Excel – Excel from Beginner to Advanced Course

This is a comprehensive Microsoft Excel course tailored for absolute beginners, and it aims to take them from beginners to advanced users of this spreadsheet program.
It covers all the basic concepts in Excel 2010, Excel 2013, and the latest Excel 2016. Even so, the course was created using Excel 2013 which contains all the features of downstream Excel 2010 and Excel 2007, as well as the upstream Excel versions to Excel 2016.
It can best be described as a 4-in-1 package as it incorporates 4 different courses into a single seamless course.
These 4 courses are Microsoft Excel 101 (Introductory course), Microsoft Excel 102 ( an Intermediate Level course), Microsoft Excel 103 (an Advanced Level course) and Master Macros ( which allows the learner to understand and use VBA after conclusion 6 simple projects).
This course package is created and updated by Kyle Pew, with the most recent update the creator has incorporated the latest Excel functions in the course.
This course is tailored for absolute beginners, and its entry requirement is for the learner to have an Internet-enabled Windows or MacOS PC (personal computer) with an installed Microsoft Office Suite 2007 or later versions.
The course is taught in English with course videos featuring auto-generated Italian, Japanese, Turkish, and English subtitles.
The course package includes the following 6 items; 14hours on on-demand videos, Mobile/TV access to videos, 5 articles/posts, 27 supplementary resources, full lifetime access to resources, and certificate of completion.

This course teaches the learner the knowledge skills described hereafter. To begin with, the student learns the basic Excel functions and how to maintain large data sets in Excel lists and tables.
Secondly, the student learns how to use dynamic formulas with MATCH, IF, INDEX, and VLOOKUP functions.
Third, the student learns how to automate tasks using VBA macros. The student also learns to create dynamic reports using Pivot Tables. Moreover, the student learns how to use AddIn and PowerPivot for data management and processing.
Furthermore, the student also learns how to audit worksheet formulas so as use only clean formulas for performing calculations.
As expected, this course package is designed to allow the learner to build a solid understanding of Excel basics. It is organized into 181 lectures with the longest lecture lasting 46minutes while the shortest one is about a minute long.
Even so, this course package does not provide in-depth coverage of any of the 10 categories of Excel functions and is designed to prepare the learner for advanced usage of Microsoft Excel as a professional tool in statistics, engineering, finance, and research.
- 4-in-1 package that includes Microsoft Excel 101, Microsoft Excel 102 , Microsoft Excel 103, and Master Macros.
- Covers Excel 2007 to Excel 2016.
- Course taught in English with auto-generated Italian, Japanese, and Turkish subtitles.
- Entire course delivered in 181 lectures.
- Trains learner on how to use VBA macros, as well as audit spreadsheet formulas.
- Provides a recognized certificate of completion.
- Does not provide in-depth coverage of any of the 10 categories of functions.
Bottom-line
This is a comprehensive 4-in-1 Microsoft Excel course package created and updated by Kyle Pew using Excel 2013.
It is tailored for absolute beginners, and it aims to take them from beginners to advanced users of this spreadsheet program. This makes it the best Excel course for beginners in Udemy.com.
2. Best course for experienced users: The Microsoft Excel Course: Advanced Excel Training

This is an advanced Excel training course created using Microsoft Excel by the 365 Careers Team and tailored for the needs of advanced users of this spreadsheet application.
It covers Excel mechanics, nested functions, modeling, and how to build complex spreadsheet-based financial models.
Even though the course was last updated in January 2021, it still contains all the features and functions of downstream Excel versions right up to current incarnations. This means all the latest Excel functions are incorporated into the course.
This course is not tailored for beginners. In fact, the minimum requirements for one to join this course is for one to have an Internet-connected Windows or MacOS PC with an installed Microsoft Office Suite 2003 or later versions, and be an intermediate user of Microsoft Excel.
This course is taught in English with course videos featuring auto-generated English subtitles.
This course incorporates the following 5 items; 5.5hours on on-demand videos, Mobile/TV access to videos, 141 supplementary resources, full lifetime access to resources, and a certificate of completion.
This course is designed to teach the following knowledge skills. It teaches the learner advanced Excel functions, as well as how to professionally format charts and worksheets (especially using cell styles).

It also teaches the learner professional-grade financial functions in Excel such as Present Value, Net Present Value, IRR, Discounted Cash Flows, and Future Value.
It also instructs the learns on the core financial modeling principles, along with design principles for effective model building.
In fact, the learner is expected to build working financial models from scratch. It also trains the learners to use scenario analysis tools to perform financial forecasting.
Moreover, the student is taught best practices in financial modeling, as well as how to build fully-integrated spreadsheet-defined financial models. Moreover, it also teaches the student how to build nested functions and flexible Excel spreadsheet models.
This course is designed for advanced Excel training with the goal of transforming an experienced Excel user into a professional builder of complex Excel-defined financial models.
It is organized into 76 lectures with the longest lecture lasting 47minutes while the shortest one is about 2 minutes long.
This course leans more at providing in-depth coverage of the finance category of Excel functions and is designed to prepare the learner for professional use of Microsoft Excel as a dedicated tool in finance.
- Teaches professional-grade Excel-defined financial functions.
- Last updated on January 2021.
- Course taught in English with auto-generated English subtitles.
- Entire course delivered in 76 lectures.
- Trains learner how to create, design, and build complex financial models.
- Provides a recognized certificate of completion.
- Not suitable for beginners.
- Prioritizes providing in-depth coverage of the finance category of Excel functions, and places little emphasis on describing the other 9 categories of functions.
Bottom-line
This is an advanced Excel training course created using Microsoft Excel by the 365 Careers Team and tailored for the needs of advanced users who want to use this spreadsheet application to do financial modeling.
It covers Excel mechanics, nested functions, and Excel-based model building. This makes it the best advanced Excel training course for experienced Excel users in Udemy.com.
3. Best course for learning charts & graphs: Microsoft Excel – Data Visualization, Excel Charts & Graphs

This is a specialty Excel course tailored for advanced level spreadsheet users who want to master data visualization using Microsoft Excel.
It prioritizes using Excel charts and graphs to visualize tabulated data. This course is created and updated by Chris Dutton using Microsoft Excel 2016.
This ensures that the latest Excel data visualization functions are incorporated in the course. As explained earlier, Excel 2016 contains all the features and functions of downstream Excel versions till Excel 2003.
This allows a learner using Excel 2003, Excel 2007, Excel 2010, or Excel 2013 to easily follow the hands-on practical lessons, and perform these practice lessons on his/her Excel worksheet.
Dutton designed this course to enable a learner to master more than 20 charts and graphs in the worksheet.
It should also be mentioned that this course is tailored for intermediate-level to advanced-level users of Excel because beginner users can experience difficulty navigating the toolbars and using the formula bar in order to generate tabulated data that is well-formatted for visualization through charts and graphs.
In fact, its minimum requirements for entry is for one to have an Internet-connected Windows or MacOS PC with an installed Microsoft Office Suite 2016 or Office 365 (as some charts are only available in these Excel versions), and be an intermediate user of Microsoft Excel. This course is taught in English with course videos featuring English subtitles.
This data visualization course incorporates the following 6 items; 4.5hours on on-demand videos, Mobile/TV access to videos, 18 articles/posts, 7 supplementary resources, full lifetime access to resources, and certificate of completion.

This course is designed to teach the following data visualization and data graphing knowledge skills. To begin with, it trains the learner to recognize when to use chart types, as well as understand why they need to be used, and how they are can be best used to achieve optimum data visualization.
Secondly, the instructor offers unique tips and uses easy-to-understand case studies to teach data visualization concepts.
Moreover, the one-on-one instructor support makes this course interactive, fun-filled, and effective in consolidating data visualization skills.
Thirdly, the learner is taught using advanced Excel demos to manage automated scroll-boards, perform dynamic formatting, and build scrolling charts.
This Excel-based data visualization course is designed for advanced Excel training with the goal of equipping the learner with data visualization skills that allow him/her to perform data analysis.
The entire course is organized into 59 lectures with the longest lecture lasting 123minutes while the shortest one is about 2 minutes long.
As expected, this course leans more at providing in-depth coverage of the statistics category of Excel functions and is designed to prepare the learner for professional use of Microsoft Excel as a dedicated tool in statistics and data analytics.
- Teaches professional-grade Excel-defined data visualization functions.
- Covers Excel 2003 to Excel 2016.
- Course taught in English with videos featuring English subtitles.
- Entire course delivered in 59 lectures.
- Trains learner how to create, design, and build complex charts and graphs.
- Provides a recognized certificate of completion.
- Not suitable for beginners.
- Some of the chart functions taught are only available in Office 365/Excel 2016 editions.
Bottom-line
This is a specialty Excel course created and updated by Chris Dutton using Microsoft Excel 2016, and designed for advanced level spreadsheet users who want to master data visualization using Microsoft Excel.
It prioritizes using over 20 different types of Excel charts and graphs to visualize tabulated data. This makes it the best Udemy course for learning Excel charts and graphs.
- Related Content: Preply Review – Good for Students? Good for Tutors?
4. Best course for learning forms and functions: Microsoft Excel – Advanced Excel Formulas & Functions

This is another specialty Excel course created and updated by Chris Dutton using Microsoft Excel 2016, and designed for advanced level spreadsheet users who want to master calculation using formulas and functions.
It teaches over 75 formulas and functions using hands-on, easy-to-understand practical lessons.
It is designed to allow the learner to gain skills and competencies of how to use the advanced Excel calculator to streamline workflow, collate data, and perform data analysis.
This course ensures that the latest Excel formulas and functions are incorporated in the course.
As explained earlier, Excel 2016 contains the formulas and functions found in downstream Excel versions till Excel 2007, and this allows a learner using Excel 2007, Excel 2010, or Excel 2013 to easily follow the hands-on practical lessons, and perform these practice lessons on his/her Excel worksheet.
Like the course reviewed above which was created by Dutton, this data calculation course is tailored for intermediate-level to advanced-level users of Excel because beginner users can experience difficulty navigating the toolbars and using the formula bar in order to group and tabulate data is a format that allows the arithmetic operators of the Excel calculator to process the data according to defined mathematical calculation instructions.
For this reason, its minimum requirements for entry is for one to have an Internet-connected Windows or MacOS PC with an installed Microsoft Office Suite 2007 or later versions, and be an intermediate user of Microsoft Excel. This course is taught in English with course videos featuring English subtitles.

This calculation-focused course incorporates the following 6 items; 6hours on on-demand videos, Mobile/TV access to videos, 1 article/posts, 8 supplementary resources, full lifetime access to resources, and certificate of completion.
This course is designed to teach the following calculation-focused knowledge skills. To begin with, it trains the learner to recognize when to use specific functions or formulas, as well as allows him/her to understand why these mathematical operators need to be used, and how they are can be best used to achieve optimum data processing outcome.
Secondly, the instructor offers unique tips and uses easy-to-understand case studies to teach data visualization concepts.
Moreover, the one-on-one instructor support makes this course interactive, fun-filled, and effective in consolidating data processing skills.
Thirdly, the learner is taught how to streamline, automate, or revolutionize work-flow using data set processing.
This calculation-based data processing course is designed for advanced Excel training with the goal of equipping the learner with data processing skills that allow him/her to perform data analysis.
The entire course is organized into 93 lectures with the longest lecture lasting 67minutes while the shortest one is about 2 minutes long.
This course aims to prepare the learner to use Microsoft Excel as a dedicated tool in statistics and data analytics.
- Teaches professional-grade, Excel-defined data processing functions using the inbuilt advanced Excel calculator.
- Covers Excel 2007 to Excel 2016.
- Course taught in English with videos featuring English subtitles.
- Entire course delivered in 93 lectures.
- Trains learner how to use advanced formulas and functions.
- Provides a recognized certificate of completion.
- Not suitable for absolute beginners.
Bottom-line
This is a specialty Excel course created and updated by Chris Dutton using Microsoft Excel 2016, and designed for advanced level spreadsheet users who want to master calculation using formulas and functions.
It is designed to allow the learner to gain skills and competencies of how to use the advanced Excel calculator to streamline workflow, collate data, and perform data analysis.
This makes it the best Udemy course for learning advanced Excel functions and formulas.
5. Best Microsoft Excel Course for Financial Analysis: Beginner to Pro in Excel – Financial Modeling and Valuation

This is a specialty Microsoft Excel course that is designed to comprehensively teach financial modeling and monetary valuation.
It offers more in-depth training as compared to the Microsoft Excel Course for Advanced and Experienced Users that have been reviewed above, which also touches on using Excel features for financial modeling.
In fact, it can be considered as the next step to the Advanced Users course as both this course and the Financial Analysis course are created, designed, and updated by the 365 Careers Team.
The Excel Course for Financial Analysis has the latest Excel functions and data analysis tools to be incorporated in the course.
Like the above-mentioned course developed by the 365 Careers Team, this Financial Analysis course is not tailored for beginners.
In fact, it requires the user to be familiar with Microsoft Excel 2010 and later versions. Its minimum requirements for enrollment are for one to have an Internet-connected Windows or MacOS PC with an installed Microsoft Office Suite 2010 or later versions, and be an intermediate user of Microsoft Excel.
This course is taught in English with course videos featuring English subtitles.
This course incorporates the following 7 items; 8hours on on-demand videos, Mobile/TV access to videos, 2 articles, assignments, 288 supplementary resources, full lifetime access to resources, and a certificate of completion.

This course is designed to teach the following knowledge skills in the domain of financial analysis. It teaches the learner advanced Excel functions, as well as how to professionally format charts and worksheets (especially using cell styles).
It also teaches the learner professional-grade financial functions including how to build a profit-and-loss statement using raw data extraction.
It also instructs the learns on the core financial modeling principles, along with design principles for effective model building.
It also teaches the learner how to cash flow statements. Likewise, the learner is taught how to value business entities.
This in turn allows the learner to know how to build valuation models from scratch. Moreover, the student is taught how to build a single model that can cater for multiple financial scenarios.
As expected, this course is designed to transform an experienced Excel user into a professional builder of complex Excel-defined financial models so as to perform financial valuation tasks. It is organized into 167 lectures with the longest lecture lasting 87minutes while the shortest one is about 2 minutes long.
This course provides in-depth coverage of the finance category of Excel functions, with some emphasis placed on finance-oriented statistical functions. It is designed to prepare the learner for professional use of Microsoft Excel as a dedicated tool in data valuation and financial modeling.
- Teaches professional-grade Excel-defined financial functions.
- Covers Excel 2010 to Excel 2016.
- Course taught in English with videos featuring English subtitles.
- Entire course delivered in 167 lectures.
- Trains learner how to create, design, and build complex financial models; and also perform financial valuation tasks.
- Provides a recognized certificate of completion.
- Not suitable for beginners.
Bottom-line
This is a specialty Microsoft Excel course created, designed, and updated by the 365 Careers Team to comprehensively teach financial modeling and monetary valuation to advanced Excel users.
It is designed to allow the learner to gain knowledge on how to use Excel spreadsheet for valuation and financial modeling. This makes it the best Udemy course for learning finance valuation and modeling.
Udemy Excel Training Buyer’s Guide

Microsoft Excel is an interactive spreadsheet program developed by Microsoft for storing, organizing, and analyzing data in a tabular format.
It is designed to abstractly simulate a blend of normal accounting worksheets and mathematical statistics.
Among its features are a scientific calculator, pivot tables, graphing tools, financial operators, and the event-driven programming language, visual basic-for-applications(VBA) – a macro based on the implementation of Visual Basic.
Pivot tables and data sorting

The pivot table summarizes data from another specified table typically by grouping, sorting, summing, and averaging the data; and this allows for efficient data processing as well as simplifies the process of data visualization using charts, graphs, or scatter plots with the pivot table serving as the data source.
The spreadsheet of Microsoft Excel uses a grid of cells to manage data and data processing. This grid is made up of numbered horizontal rows, and letter-named vertical columns.
A cell is defined as the unit formed when a single row intersects with a single column, and as such a cell is named conventionally after the column name and row number that intersects, for instance, the first cell in an excel spreadsheet is named Cell A1.
Each cell contains a data, data variable, or flotation data. The cellular organization of data allows for data manipulation using mathematical formulas, with the data contained in a cell serving as the raw value to be manipulated.
- Related Content: What is the Best Java Course on Udemy (Top 5 Reviews)
Understanding Cells

Initially, Microsoft Excel could handle up to 16,384 rows in its Versions 1- Version 7 series. This improved in Version 8 to Version 11 which can handle up to 256 columns and 65,356 rows which gives these versions a total cell count of 16,731,136 cells. Currently, version 12 can handle up to 16,384 columns and 1,048,576 rows which gives this version a total cell count of 17,179,869,184 cells.
The basic components of an Excel Spreadsheet are the standard toolbar, formatting toolbar, name box, formula bar, task pane, column headings, row headings, active cell, sheet tabs, tab scrolling buttons, and the pointer.
The active cell is the cell being edited, changed, or manipulated; and its name is displayed in the name box, while its contents are displayed in the formula bar.
Primary arithmetic operations
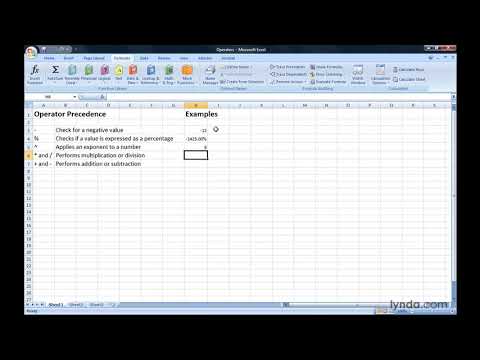
As mentioned earlier, an Excel spreadsheet works to process and manipulate data using mathematical operations, and there are 5 primary arithmetic operations used: addition, subtraction, division, multiplication, and exponentiation.
Excel allows users to use an order of precedence to create mathematical expressions, for example, 15 X A5 means to multiply the value of cell A5 with 10, while A5/B6 means to divide the value in cell A5 with the value in cell B6.
The process of data entry into an Excel spreadsheet is quite simple as data can be entered in one of two ways, directly into the desired cell, or by clicking the desired cell and then entering the data in the formula bar. This data is manipulated and processed using mathematical equations.
Formulas in Excel

There are 2 key terms in Excel spreadsheets; formulas and functions. Formulas are basically equations for performing calculations in the spreadsheet.
Some of these formulas are Excel-defined, which allows for complex equations to be hardcoded in the Excel calculator program.
Functions in Excel
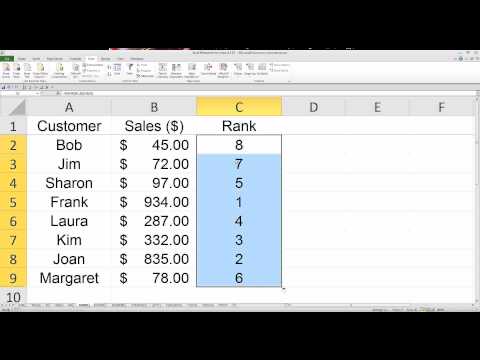
These Excel-defined formulas are called functions. These functions are designed to solve arithmetic problems in statistics, engineering, and finance.
Currently, there are more than 350 functions in Microsoft Excel 2010 and later editions, and these functions are organized (or categorized) into 10 categories: Database, Statistical functions, Text and Data, Engineering, Math, Financial, Information, Lookup, Logical, and Date and Time.
